Two important studies came out of California this week that directly measured the prevalence of COVID-19 in the general population. The authors of the studies have been put under a microscope because their findings force us to change our baseline assumptions about the nature and mortality of COVID-19. But is this really groundbreaking information, or have there been clues hinting at this the entire time? To really understand the mortality maze, we have to start at the beginning.
Case Fatality Rate (CFR) and the Morphing Mortality Recommendations
CFR is the simplest method of calculating mortality. To find the CFR of a disease, researchers take the number of people who die of the disease and divide it by the number of people who test positive for it. As simple as that seems, however, there is a lot of ambiguity about both numbers.
According to the Johns Hopkins coronavirus research center, COVID-19 has a CFR of about 5.7 percent in the United States. This means that someone who tests positive for the coronavirus has a 5.7 percent chance of dying of the disease. But this is not an accurate estimate of the fatality associated with COVID-19. Why? Because the sickest people are tested first, and many people who are and were infected with COVID-19 are never tested at all.
To put this in perspective: Last winter 250,000 people tested positive for the flu. 25,000 died. If these numbers are right, the CFR for the flu is 10 percent … but that can’t be right.
And, in fact, it isn’t. The Centers for Disease Control and Prevention (CDC) estimates that, although only 250,000 people tested positive for the flu last year, 39 million people actually got it. Generally only those who are older or otherwise unhealthy, or those who have a severe case, go to the doctor and get tested for the flu; everyone else just takes Motrin and Tylenol and stays home. This drives up the CFR dramatically.
Returning to the coronavirus, the CFR gets even more complicated when you consider that the criteria for death from the disease keeps changing. On April 14, 2020, New York City announced that it would change its criteria for a death from COVID-19 in accordance with the CDC recommendations:
As of April 14, 2020, CDC case counts and death counts include both confirmed and probable cases and deaths. This change was made to reflect an interim COVID-19 position statement issued by the Council for State and Territorial Epidemiologists on April 5, 2020. The position statement included a case definition and made COVID-19 a nationally notifiable disease.
So New York City and several other states began reporting mortality with the “updated” recommendations. The below charts demonstrate what happened.
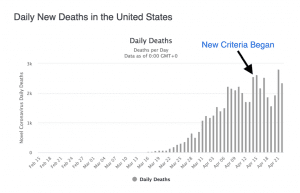
The updated reporting from the CDC has cast significant doubt upon the most stable statistic we had, mortality. Before April 14, a single man who died at home of a heart attack would have not been counted as a COVID-19 death, but after April 14 he probably was.
The Ever-Decreasing Infection Fatality Rate (IFR)
If we look back to the flu statistics, you will remember the CDC estimated that 39 million people had the flu this year. How did they come up with that number when only 250,000 people tested positive? The CDC monitors people who go to the doctor with influenza-like illness (ILI). They know that many people do not get flu tests, but their outpatient illness surveillance systems attempts to capture the total flu by looking at the levels of ILI and comparing it to areas with known influenza epidemics.
Why do I bring up ILI? Well, researchers noted that there was a spike in ILI in March. They took the CDC’s ILI data and used the CDC’s technique to estimate the incidence of the flu to estimate the incidence of COVID-19. In this way they compared this year’s ILI burden from March 8 to March 28 to the past several years and found that there were an excess of 8.7 million cases in this 20-day span! The report states, “Together these results suggest a conceptual model for the COVID-19 epidemic in the US in which rapid spread across the US are combined with a large population of infected patients with presumably mild-to-moderate clinical symptoms.” Researchers knew this number was huge and tried to soften it by saying, “We emphasize the importance of testing these findings with seroprevalence data.”
Similarly, as early as March 24, researchers at Oxford University created a mathematical model of the infection in the UK and concluded that over half the UK was already infected. They were surprised by their finding and asked for widespread antibody testing to help confirm their hypothesis. Their model predicted an IFR of 0.1 percent.
Additionally, Kinsa is a company that makes a smart thermometer that works with smartphones. They make the aggregate data available online. An enterprising financial analyst looked at the fever patterns in the United States: “Almost every state experienced the same fever pattern. Starting in mid-February fevers were declining as they usually do this time of year as the flu season wanes, but then around 3/1, the decline stopped and in most states moved to atypical levels.” It is hard pin down an exact number, but there is no doubt there was a large unexpected spike.
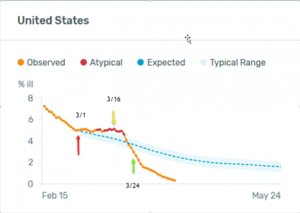
This could be evidence into how much more prevalent COVID-19 is than early testing showed.
Now that we have looked at indirect evidence, what direct evidence is there that COVID-19 is much more common than we previously believed? Every study that has tested for COVID-19 in healthy individuals has found the disease’s prevalence to be surprisingly high, especially that of asymptomatic cases. These studies looked for the actual virus from a mouth or nasal swab using a technique called polymerase chain reaction (PCR). One of these was a study done at Columbia University, which tested every woman presenting for labor for COVID-19 for almost a month. Researchers found a 15 percent positive rate, and 88 percent were completely asymptomatic. Another study at a Boston homeless shelter tested nearly 400 guests, 146 of which tested positive. All were asymptomatic. Yet another study on the USS Theodore Roosevelt tested 94 percent of the crew for the virus, with 678 of 4,069 sailors testing positive. Sixty percent of these 678 have been asymptomatic.
Antibody Testing — Cries of Bias
Now that we have laid the groundwork, what about the two recent studies from California? Unlike the previous reports mentioned, these tests looked for antibodies in the blood instead of viral infection and attempted to estimate seroprevalence, which represents the percentage of the population that has developed antibodies to COVID-19.
The first study came out on April 17:
The Stanford researchers tested 3,330 people on April 3 and April 4 at three locations spaced across Santa Clara County — two county parks in Los Gatos and San Jose and a church in Mountain View — to gain a snapshot of how many people in the county already had been infected but weren’t seriously sick and didn’t realize it…. The Santa Clara County study concluded that the virus had infected 2.5% to 4.2% of residents…. This was 50 to 85 times more than the number of official cases at that date.
On April 20, a second study came out from USC on Los Angeles County:
863 adults were selected through a market research firm to represent the makeup of the county…. 4.1% of adults have antibodies to the virus in their blood, an indication of past exposure. That translates to roughly 221,000 to 442,000 adults who have recovered from an infection, once margin of error is taken into account, according to the researchers conducting the study. The county had reported fewer than 8,000 cases at that time.
Based on the results of these studies, COVID-19’s IFR would be in the range of 0.12 percent to 0.2 percent. As you can guess, this caused a firestorm of controversy.“I think the authors owe us all an apology… not just to us, but to Stanford,” Andrew Gelman, a professor of statistics and political science and director of the Applied Statistics Center at Columbia University, said in response.
So what is the problem with these studies? First, the authors dared to question the dogma of universal quarantine. Back in March, Jay Bhattacharya and Eran Bendavid, two of the researchers involved in the new studies, “wrote an editorial in the Wall Street Journal arguing that a universal quarantine may not be worth the costs. Their colleague John Ioannidis also wrote that we lacked the data to make such drastic economic sacrifices.” This caused other statisticians and researchers to accuse the authors of “having agendas before going into the study.”
Second, many researchers are not familiar with the Oxford and ILI data. In their eyes, then, this Stanford study must be systematically biased because the results are so much higher than they have previously seen.
Now, every study has its strengths and weaknesses. Innate difficulties present themselves when you’re trying to find the prevalence of a relatively uncommon disease. This was true for the studies that came out of California, and other researchers looked for these. The first attack on the Stanford study was the specificity of the test kit itself. To evaluate this specific kit, the company Premier Biotech, a Minneapolis-based company, looked at 377 samples of blood from before COVID-19 arrived in the United States. They found two false positives in the 377 samples. The Stanford researchers wanted to confirm Premier Biotech’s results and applied the test to 30 samples of blood from before COVID-19 arrived. They found zero false positives. All in all, there have been two false positives in 407 total tests. This gives a specificity of the test of 405/407 or 99.5 percent. In other words, for every 200 people sampled, you would expect one false positive.
Now, there is an element of uncertainty in that number. The true specificity could be as high as 99.9 percent and as low as 98.6 percent. Even if you assume the 98.6 percent low estimate, that could mean as many as 1.4 percent of the 4.1 percent could be false positives. But that still would show an incidence of 2.7 percent, which would still be an increase of 25 times over the previous testing.
The mantra of the many for the past month has been testing, testing, testing. Now that we have the results from the largest-scale testing to date, people are attacking it because it does not fit their narrative. Yet, there is now a new wrinkle in our story.
An antibody study on a high school in Oise, France was released on April 18. It showed 25.9 percent of the pupils, teachers, and parents had been exposed to the virus.
An antibody study of New York State came out on April 23. It showed that “In New York City, about 21 percent, or one of every five residents, tested positive for coronavirus antibodies during the state survey. The rate was 16.7 percent in Long Island, 11.7 percent in Westchester and Rockland Counties, and 3.6 percent in the rest of the state.” As of this writing, New York City has 11,267 deaths. 8.3 million people live in New York, so approximately 1.73 million New Yorkers have been exposed, which leads to a IFR of 0.65 percent for New York City.
As high as the incidence of antibodies was in the New York City study, this undermines many of the low prevalence arguments. One important difference, however, is that the calculated IFR in California was between 0.12 percent to 0.2 percent, while the IFR in NYC is 0.65, at least three times higher.
The Conundrum Explained — Viral Load Exposure
Now, this information does present a conundrum. If the mortality in California is 0.2 percent, why have so many people died from it? Why are health-care workers at such high risk of severe infection? And why has almost half of the mortality in the U.S. come from one city with only about 3 percent of the population?
Why? Because not everyone with COVID-19 is equally dangerous. People who are critically ill have a dramatically higher number of virus particles in every cough, breath, and sneeze. The virus starts off in infinitesimal amounts in a patient’s blood. The virus count, also known as viral load, increases slowly at first and much more rapidly thereafter. The amount of virus in the air can also increase dramatically with medical procedures that cause aerosolization of the virus. Intubating a COVID-19 patient, for example, may result in exposure to a particularly high viral load.
The exposure the medical professional faces in this situation is very different than, say, if a person is exposed by their friend on the Santa Monica pier. If a person is exposed on the pier, they may get a very small “dose” of COVID-19, which their body then has time to find and attack before they get sick. During this period the viral load is very low, and if they infect someone else that person will also likely have a mild course. Health-care workers who intubate sick COVID-19 patients, however, are likely to be exposed to a viral load thousands of times higher than someone who was exposed in the community. This is why the doctors and nurses who take care of these patients are heroes. They know how dangerous it is to take care of the sickest COVID-19 patients, and they do it anyway. It is also why adequate personal protective equipment is vital. Asking a health-care worker to wear a bandana while being exposed to such high viral loads is wrong and should never happen again.
This also explains why people in New York, who are much more likely than others in the country to ride the subway for transportation, have had a much higher risk of the disease.

New York City subway
If COVID-19 is common and sick COVID-19 riders with fevers are breathing and coughing on you, can you imagine that you would be exposed to a much higher viral load? Can you understand why patients in New York City could have a higher risk of serious disease? Also, imagine you live in a culture where you greet every person you meet with a hug and kiss. This is a common custom in Spain, France, and Italy.
As the preliminary studies are showing, we do find that the mortality in New York City is likely higher than in California, and there is a plausible explanation for this.
Summary
Based on these studies, it is clear that COVID-19 is more prevalent and less deadly than previous testing has shown. In addition, it has become clear that the disease progression is generally mild in those under 65 with limited co-morbidities and even less of a threat to children. Knowing how low the risk is for the vast majority of Americans, which is rapidly approaching the mortality rate of the flu, we can safely reopen most of the country’s economy while continuing to protect those who are most at risk from COVID-19. Once shelter-in-place orders have been lifted, those who remain fearful are free to continue to shelter in place for as long as they so choose. There is more than enough information available at this time to reopen America.