

I’ve got a bone to pick with Coronavirus (CV) data.
CV data isn’t tracked by city: it’s tracked by zip code (too detailed) and by county (not specific enough).
Instead, in this article, I’ll assume the main county represents the main city. In other words, the main county includes most of the main city population, although city and county are not correlated one-to-one.
The assumption works well for most cities, so the point I make is valid: Cases and deaths are highest in a few large cities.
The table shows data by U.S. city for counties with the largest number of deaths from CV:
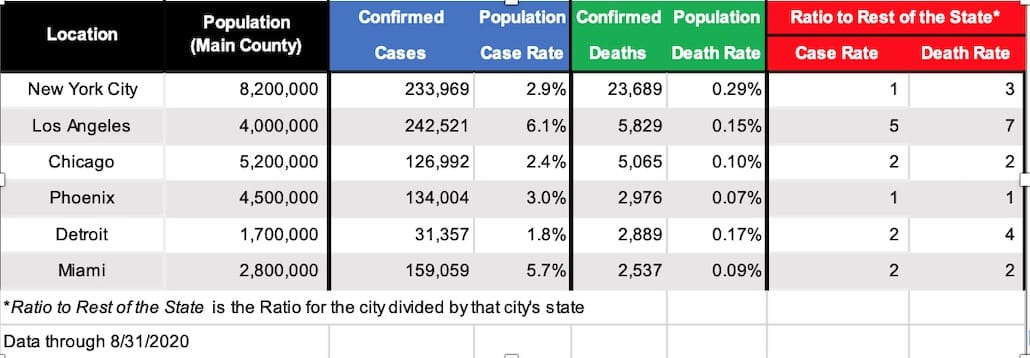
The chart is remarkable in that it shows data by city, the first of its kind. These six cities can be compared to each other, as well as the comparison I’ve added in the red columns, where the case and death rates are compared to the case and death rates in the rest of their respective states.
For example, New York City has essentially the same case rate as New York State (outside of NYC), while the death rate for NYC is 3 times that for the state. That’s a remarkable outcome, that while the NYC case rate is similar to the rest of the state (actually about 40% higher using decimals that are not shown), while the death rate is 3 times higher. This measures what others have speculated, that CV has hit residents quite hard in the city.
The worst city, relative to the rest of the state, is Los Angeles, where the ratios are 5 and 7 times higher than for the rest of California. Detroit also has poorer ratios than the rest of Michigan. In fact, the death rate in Detroit is second highest to NYC, such that 0.17% of residents have died from CV.
What is the cause of this? Of course, there is no formula that explains the situation in every location. But I’d like to analyze two key factors that the Media has not: Direct flights from Wuhan, and population density.
There were only two cities in the U.S. with direct flights from Wuhan China: New York City and San Francisco. San Francisco, interestingly, did not succumb to the same problems that New York City did.
But direct flights from Wuhan to other European cities — Rome and London — seemed to have had an impact on the number of cases in those countries. Interestingly, Europe had no other direct connections to Wuhan, although of course many travelers had connecting flights.
As expected, population density varies greatly in the U.S. The average is 94 people per square mile (the world average is 129 per square mile, such that the U.S. is below average). However, NYC averages 26,403 people per square mile! And the least dense city of the others in the table is Phoenix with 3,126 people per square mile.
So, to the extent that the infection is spread further in congested areas, cities are more likely to have cases, hospitalizations, and deaths as a result.
By contrast, South Dakota has suffered 167 total deaths and 10,000 cases amongst its 900,000 people (population density of 11 per square mile), which is a death rate of 0.02%.
The bottom line is averages can be deceiving. State-based data, while useful to consider, “hides” what’s really going on, that more-populated areas are suffering more from CV.
While we intuitively know this, data being gathered through most entities does not provide the level of detail needed to understand what’s happening. Typical data analysis implies the alarm be sounded in all counties, states, and the U.S. generally because the data is not detailed enough to show large cities versus non-cities.
This more-detailed analysis can be performed for each city/state. In other words, every county in the country can be analyzed in such a fashion. Credibility of the data comes into question, of course, as county data may not be robust enough, but details like this can give Governors insights into what’s going on in their states. But the data in the suburbs shouldn’t be masked by the cities.
The bottom line is to gather the data specific to where you live, and think about how CV isn’t EBOLA. Most of the people in the U.S. don’t live in NYC. There are 125,000 schools and 15,000 nursing homes that are not in NYC. Government one-size-fits-all rules don’t fit in most locations.
Rich Yurkowitz is a healthcare actuary and author of the upcoming book, Medicare For All, Really?!